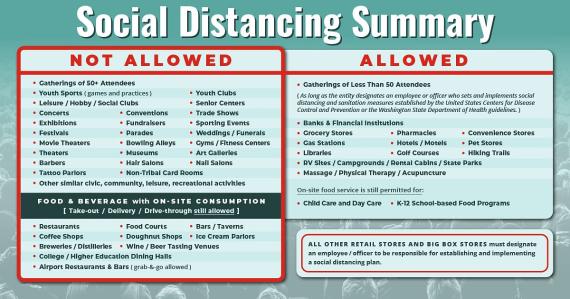
Last March, it quickly became clear to the nation’s governors that the federal government would not be taking the lead in enacting policies geared towards stopping the spread of the coronavirus. What emerged instead was a patchwork of widely varying state responses to the same disease. Some governors responded quickly by adopting stay-at-home orders, limiting public gatherings, and closing schools and businesses. Others were slower to act or did not act at all. After the success of the initial effort to ‘bend the curve’ in March and April, some governors quickly eased their social distancing policies while others delayed. This pattern of differing responses continued as the next wave hit during the summer and then again in the fall.
In March 2020, Christopher Adolph, along with a team of graduate students and faculty, took on the daunting task of tracking and building a record of these state responses. As political scientists, their original goal was to study whether these variations were best explained by differences in state health and economic differences or by partisan politics. As part of their research process, they made their data publicly available through GitHub (covid19statepolicy.org) and soon discovered that others were using it for their own purposes.
One of the first outside users was the UW’s Institute for Health Metrics and Evaluation (IHME), which produces the COVID-19 cases and death forecasts widely reported in the media and used by policymakers. Their models assume that changes in social distancing policies matter for disease transmission and continue to rely on the COVID-19 State Policy Project’s data for updated data on changes in state policy.
Imperial College of London had also used the data to make their own forecasts and to study the health impacts of social distancing policies. COVID Exit Strategy (now a part of COVID Act Now) draws on the COVID-19 State Policy Project for data on mask mandates, and Tableau has used the projects’ data on business closures and restrictions to guide national firms in their efforts to adapt to the crisis
One of the benefits of this external interest has been funding for graduate students. For the first few months, support came from the UW’s Center for Statistics and the Social Sciences and the department’s Donald R. Matthews Endowment. Since then, the project has received $150,000 from an external foundation, enabling the department to fund eight graduate research assistantships during the fall and winter quarters. In addition to Adolph, the team includes department chair John Wilkerson, global health metrics PhD student Nancy Fullman, political science doctoral students Kenya Amano, Bree Bang-Jensen, Rachel Castellano, Carolyn Dapper, Megan Erickson, Beatrice Magistro, Grace Reinke, and Evan School doctoral student Rebecca Walcott.
And what does explain all of those state variations? The team has written three academic papers to date, all of which find that the party affiliation of the governor, not health or economic conditions, is the most important explanation for differences in state social distancing policies and mask mandates.
